PeakUtils tutorial
This tutorial shows the basic usage of PeakUtils to detect the peaks of 1D data.
Importing the libraries
import numpy
import peakutils
from peakutils.plot import plot as pplot
from matplotlib import pyplot
%matplotlib inline
Preparing the data
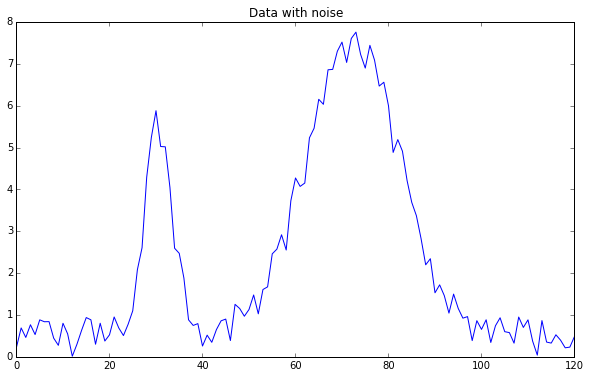
Lets generate some noisy data from two Gaussians:
centers = (30.5, 72.3)
x = numpy.linspace(0, 120, 121)
y = (peakutils.gaussian(x, 5, centers[0], 3) +
    peakutils.gaussian(x, 7, centers[1], 10) +
    numpy.random.rand(x.size))
pyplot.figure(figsize=(10,6))
pyplot.plot(x, y)
pyplot.title("Data with noise")
Getting a first estimate of the peaks
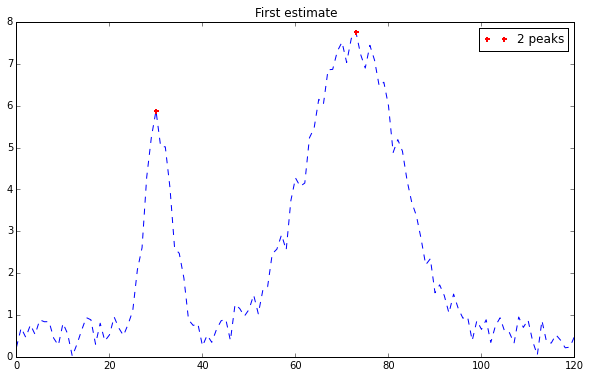
By using peakutils.indexes, we can get the indexes of the peaks from the data. Due to the noise, it will be just a rough approximation.
indexes = peakutils.indexes(y, thres=0.5, min_dist=30)
print(indexes)
print(x[indexes], y[indexes])
pyplot.figure(figsize=(10,6))
pplot(x, y, indexes)
pyplot.title('First estimate')
[31 74]
[ 31.  74.] [ 5.67608909  7.79403394]
Enhancing the resolution by interpolation
We can enhance the resolution by using interpolation. We will try to fit a Gaussian near each previously detected peak.
peaks_x = peakutils.interpolate(x, y, ind=indexes)
print(peaks_x)
[ 30.58270223 72.34348214]
Estimating and removing the baseline
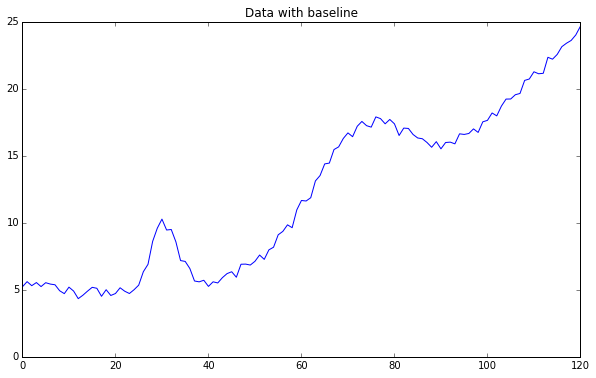
It is common for data to have an undesired baseline. PeakUtils implements a function for estimating the baseline by using an iterative polynomial regression algorithm.
y2 = y + numpy.polyval([0.002,-0.08,5], x)
pyplot.figure(figsize=(10,6))
pyplot.plot(x, y2)
pyplot.title("Data with baseline")
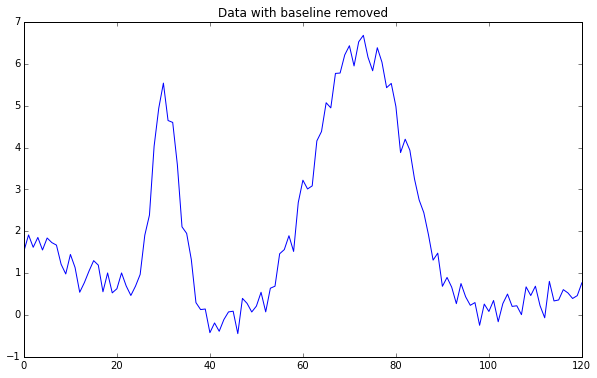
base = peakutils.baseline(y2, 2)
pyplot.figure(figsize=(10,6))
pyplot.plot(x, y2-base)
pyplot.title("Data with baseline removed")